
Sales forecasting is a projection of expected customer demand for the product or service at a company and it is calculated for a specific time period. Here we are sharing a detailed article on Sales Forecasting. its meaning, types, methods, and techniques of the sales forecast.
► What is Sales Forecasting?
Sales forecasting is used for business planning, sales, marketing, and management decision-making.
Sales forecasting is the process of estimating what future sales may reach your company. Companies use techniques of sales forecasting to predict weekly, monthly, quarterly, and annual revenue and break-even point.
◉ Sales Forecasting Meaning
Sales forecasting simply means predicting or calculating how many products or services your company could sell over a period of time.
◉ Definition of Sales Forecasting
According to Cundiff and Still,
“Sales forecasting is an estimate of sales for a specified future period that is tied to a proposed marketing plan and which assumes a particular set of uncontrollable and competitive forces.”
According to Philp Kotler (Father of Marketing),
“Sale Forecasting is the expected level of sales of the company based on a chosen marketing plan and assumed marketing environment.”
► Importance of Sales Forecasting
Companies use sales forecasting as it has significant importance in factors such as follows;
- Sales Planning
- Better optimization of Cash flow
- Better Resource planning
- Demand forecasting
- Inventory management
- Supply chain management
- Understanding customers better and their choices
- Identify the market trends and sales pattern
- Determine expected ROI to boost sales
► Methods of Sales Forecasting (Techniques)
There are various methods or techniques of Sales Forecasting. These methods are mainly divided into two categories;
- Qualitative Methods
- Quantitative Methods
✔ 1. Qualitative Method
- Salesforce Opinion Method
- Delphi Technique
- Sales force composite method
- Survey of Buyers’ Expectational
✔ 2. Quantitative Methods
- Historical Analogy Method
- Test Marketing
- Time Series Analysis
- Moving Average Method
- Regression Analysis
Now let’s discuss all the methods and techniques of Sales forecasting in detail.
✔ 1. Qualitative Method
◉ Salesforce Opinion Method
In Sales Team Opinion Method, the Senior Manager asks his team for input on expected demand from each team leader of the sales team.
- Each team leader and Area Sales Manager estimate the respective region and product categories and present customer demand.
- Finally, the Head of the Sales Teams analyzes all the estimations and generates the final version of the demand forecast.
◉ Delphi Technique
The Delphi technique is a method of sales forecasting in which a panel of forecasting experts generates a demand forecast where each expert makes a forecast of a specific segment.
- Once the initial forecasting round is finished, each expert shares the forecast with the management or as the process requires, is influenced by others.
- After reviewing all forecasts, all participants again make a consequent forecast and the process repeats until they all reach a near consensus scenario.
◉ Sales Force Composite Method
The sales force composite method involves sales persons estimating their future sales. It is based on a bottom-up approach and is also known as the grassroots approach.
- In this method, each salesperson estimates in his sales territory how much quantity or units potential customers will buy.
- The sales forecast is made up of a composite of all the sales persons. These estimates are collectively reviewed at a higher management level.
- This method is often used by industrial or manufacturing businesses.
◉ Survey of Buyers’ Expectations (Market Survey)
In this method, a representative from the company asks existing and potential customers about their likely purchases of the company’s product or services for the forecast period.
- This method is also known as market research or market survey.
- Most all company conduct periodic market surveys of consumer buying intentions.
- Market research studies seek personal, demographic, interest, and financial information from end-users by asking questions.
- This method is useful for products that have little to no demand history.
✔ 2. Quantitative Methods
◉ Historical Analogy Method
The historical analogy method is used where a demand forecast may be derived by using the history of a similar product.
- Multiple equivalence groups of analogous series are made to make a more accurate forecast than what can be made with a single series or judgment alone.
- In this method, existing products or generic products could be used as a model for the main product. For example, demand for CDs is caused by DVD players.
◉ Test Marketing
The Test Marketing method is used to forecast the demand or sales for a new product that has yet not been officially launched in the market.
- In this method, a test is selected. It may be a region, city, or state which is representative of the total market.
- After the selection of the test area, that new product will be launched in the area.
- If the product is successful in the test area, then the forecast will be that similar levels of success will be achieved in the total market.
◉ Time Series Analysis
In the time series method, a set of observations on a quantitative variable is collected over a period of time.
- For example historical data on sales, inventory, and the number of repeat customers.
- Analysis of the past behavior of a variable is done in order to predict its future behavior.
- Time Series Analysis is very useful for short-term demand or sales forecasting.
- Mostly used in fast-moving consumer goods (FMCG) & commodity markets.
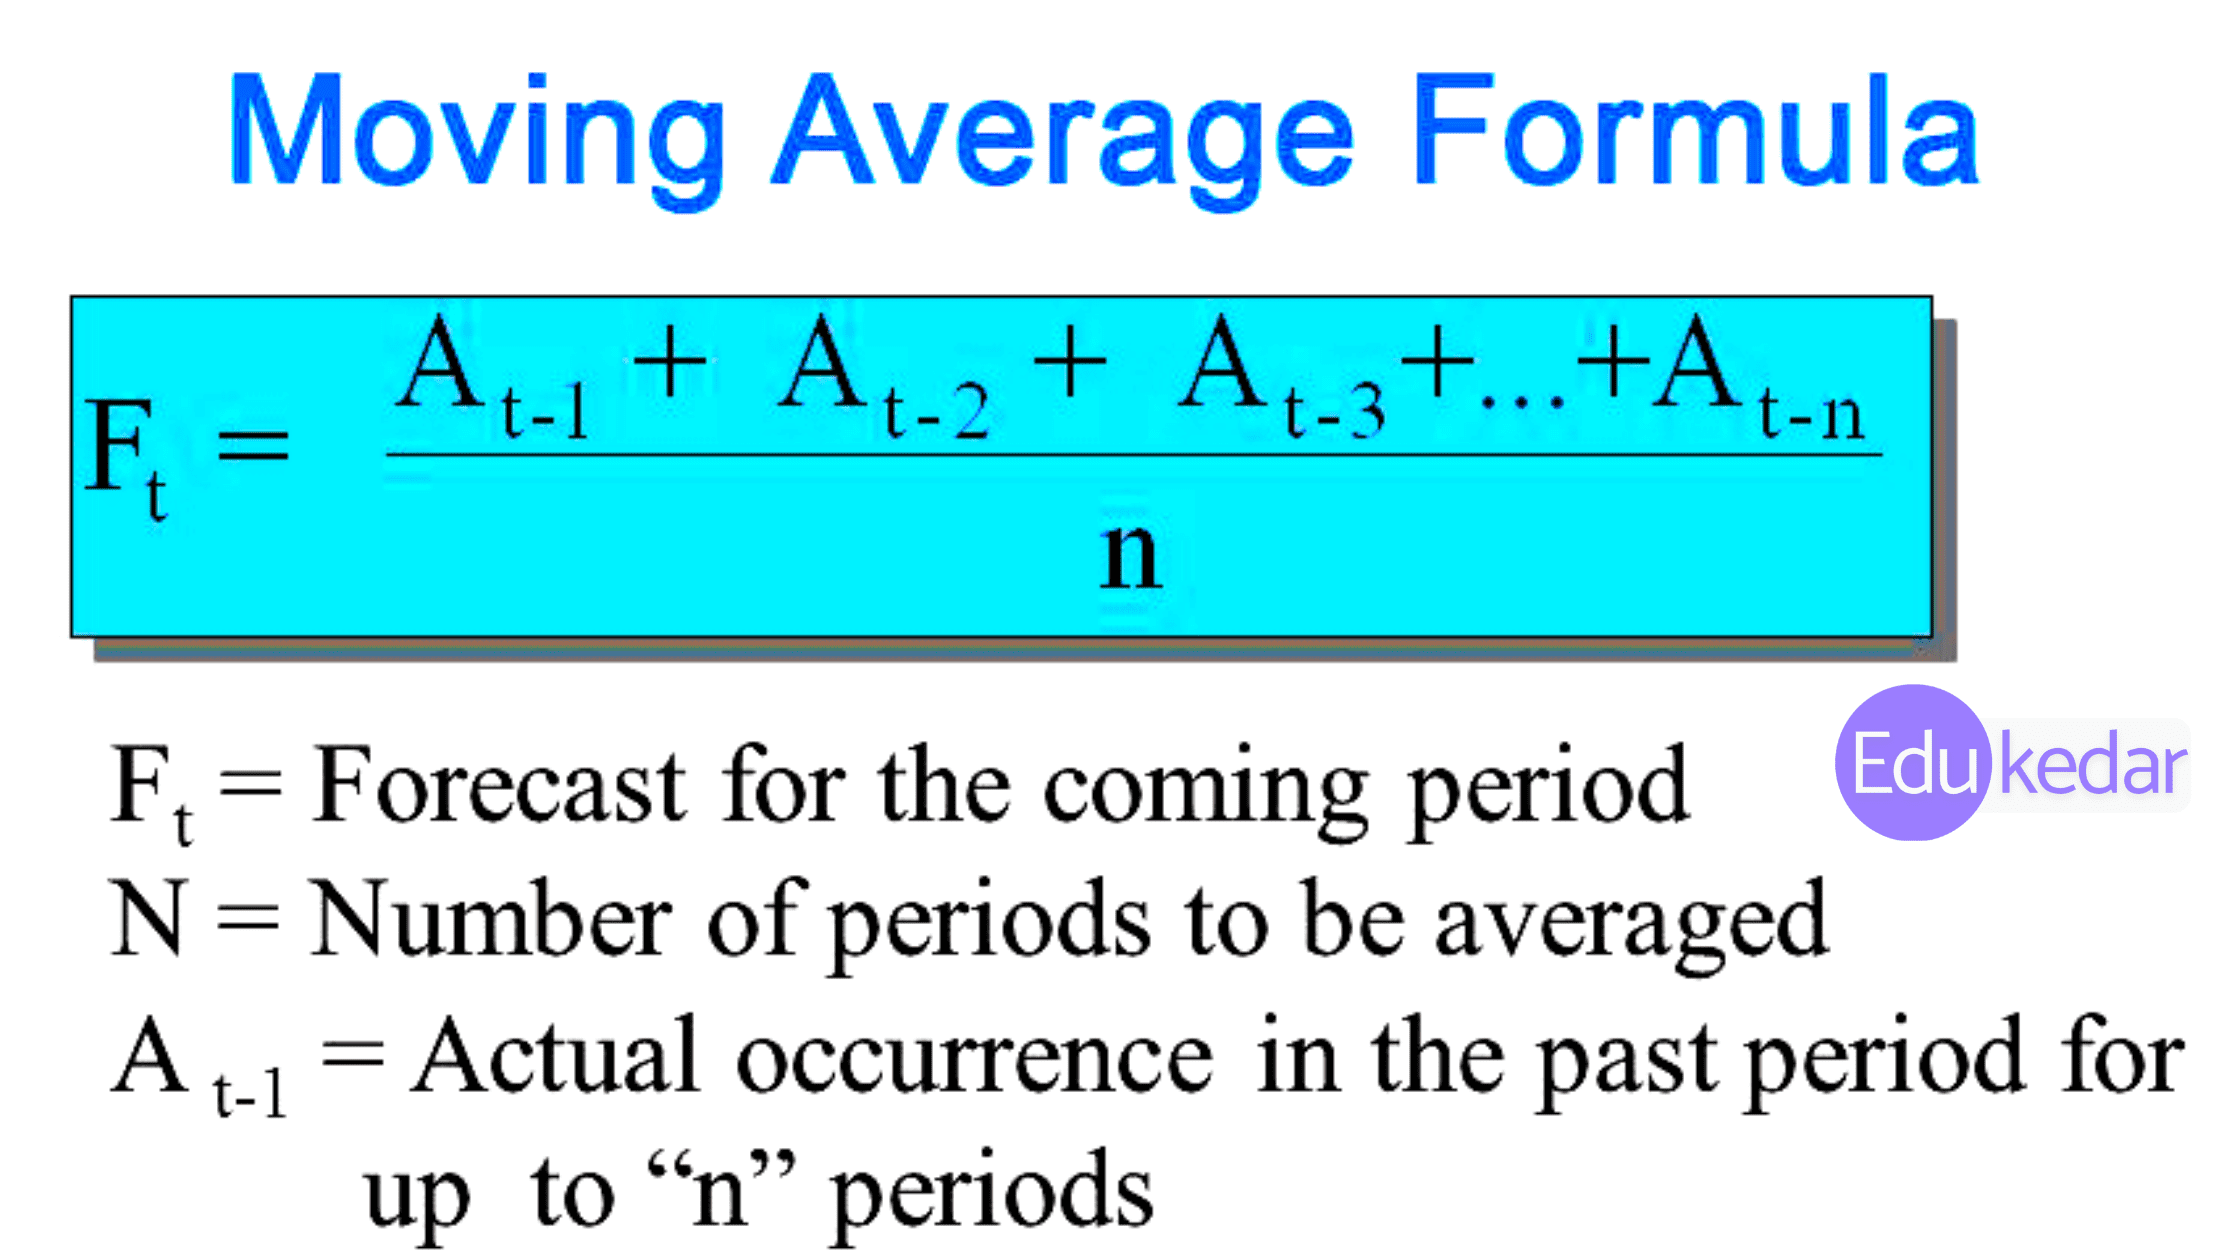
◉ Moving Average Method
The simple moving average model assumes an average is a good estimator of future behavior. The formula for the simple moving average is given below.
◉ Regression Analysis
Once a linear relationship is defined, the independent variable can be used to forecast the dependent variable.
- Determine the dependent and independent variables
- Develop scatter plots and determine if linear or nonlinear relationships exist. Calculate a correlation coefficient. Transform nonlinear data.
- Run an autocorrelation and interpret the results – it will be helpful to see if any pattern exists.
- Compute the regression equation. Interpret.
- Understand the difference between the standard error of estimate, standard error of forecast (regression), and standard error of the regression coefficient.
- Evaluate and interpret the adjusted R-square
- Test as the independent variable for significance
- Evaluate the ANOVA and test the model for significance (F and DW)
- Plot the error terms
- Calculate a prediction and prediction interval
- State Final conclusion about the model (if running different models, compare using MSE, MAD, MAPE, MPE)
► Benefits of Sales Forecasting
- Improves Inventory Control
- Helps to determine gaps in resources
- Aids planning marketing strategy
- It helps in preparing the Sales Budget
- It is fairly accurate
Limitation of Sales Forecasting
- It is based on prediction and sometimes guesswork.
- The forecast may be wrong if research data is inaccurate.
- If the Sales Manager has a vested interest then It may be biased.
- It is time-consuming and expensive.


